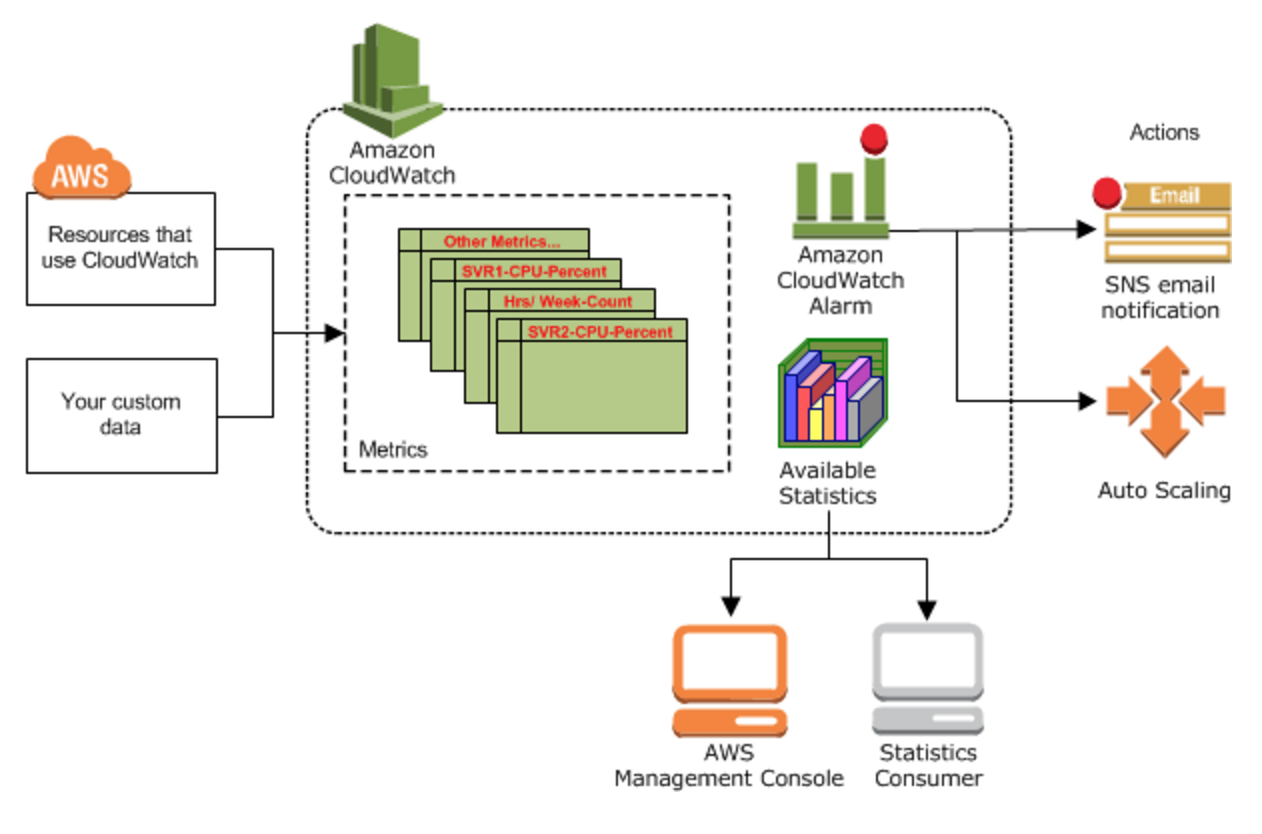
Overview
- real-time monitoring of AWS services & the applications that run on them
- metrics: variables you want to measure for your resources and applications
- alarms: rules that you define that send notifications or automatically make changes to the resources you are monitoring
- basic monitoring: a service sends data points to CloudWatch every five minutes
- detailed monitoring: a service sends data points to CloudWatch every minute
- source: http://docs.aws.amazon.com/AmazonCloudWatch/latest/monitoring/cloudwatch_architecture.html
Concepts
Metrics
- a time-ordered set of data points that are published to CloudWatch
- can be custom, or AWS-service specific defaults (e.g. EC2 CPU usage consumption)
- you can receive statistics about those data points as an ordered set of time-series data
- uniquely identified by: name, namespace, dimension(s)
- metric data is stored for 2 weeks
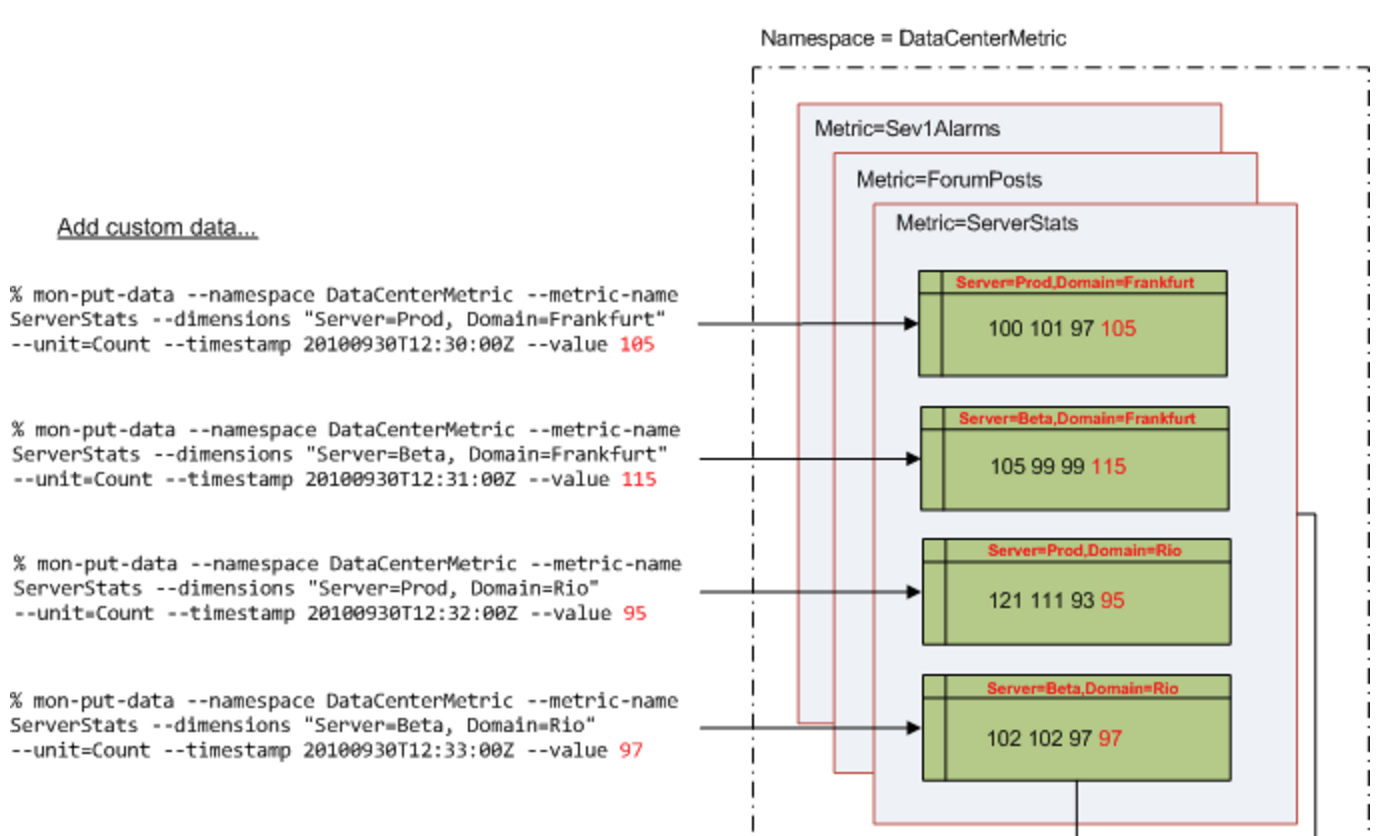
Namespaces
- containers for metrics
- Metrics in different namespaces are isolated from each other, so that metrics from different applications are not mistakenly aggregated into the same statistics
Dimensions
- name/value pair that helps to identify a metric
- “Every metric has specific characteristics that describe it, and you can think of dimensions as categories for those characteristics”
- CloudWatch treats each unique combination of dimensions as a separate metric
- examples:
- Server=Prod,Domain=Frankfurt
- Server=Prod,Domain=Rio
Units
- a statistic’s unit of measure
- e.g. Seconds, Bytes, Bits, Percent, Count, Bytes/Second
Statistics
- metric data aggregations over specified periods of time
- Aggregations are made using the namespace, metric name, dimensions, and the data point unit of measure, within the time period you specify
Periods
- A period is the length of time associated with a specific Amazon CloudWatch statistic
- A period can be as short as one minute (60 seconds) or as long as one day (86,400 seconds)
Aggregation
- Amazon CloudWatch doesn’t differentiate the source of a metric…allowing you to [for example] get the statistics for minimum, maximum, average, and sum of all requests across your application
Alarms
- Alarms can automatically initiate actions on your behalf, based on parameters you specify
- An alarm watches a single metric over a specified time period, and performs one or more actions based on the value of the metric relative to a given threshold over a number of time periods
Regions
- Amazon CloudWatch does not aggregate data across regions
- metrics are completely separate between regions